
Pipeline Velocity
Read time: 6 minutesWritten by:
-

Edward Reynolds
CEO, Founder
What is the single North Star our entire Revenue Team can rally around?
Revenue is obviously the ultimate goal but it’s a lagging indicator, showing results from yesterday’s efforts, not what’s happening right now.
To see what our Revenue Team is producing today, we need to know:
- How much Pipeline we’re generating now
- Whether our Close Rate is going up or down
- If our Average Sales Price is growing or shrinking
- What’s happening to the length of our Sales Cycle
Each of these are simple enough to calculate but it’s a lot for our busy team to process four different metrics moving in different directions. Thankfully, Pipeline Velocity combines all four into one single metric our team can align on.
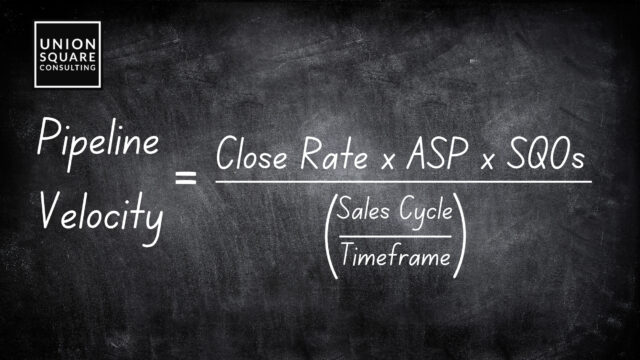
To calculate it, we start by multiplying our Close Rate by our Average Sales Price by the number of Sales Qualified Opportunities generated. We then take this number and divide it by the number of days in our Sales Cycle over the number of days in the Timeframe we want to measure.
Let’s dig into these variables and how to calculate each of them.
Step 1: Define Your Timeframe
Pipeline Velocity tells us how much revenue we’re moving through our pipeline within a given timeframe, such as a quarter.
If we remove Timeframe from this equation (or set it to 1), as you’ll often see in other articles like this, the formula would just show our daily Pipeline Velocity, or how much Pipeline we are moving through our funnel each day.
We advocate most companies should calculate Pipeline Velocity quarterly, comparing each quarter to previous quarters. Unless we have an extremely short sales cycle, tracking it monthly will probably give us volatile numbers that confuse more than clarify.
For the sake of this article, we’ll just use quarterly as our timeframe.
Step 2: Calculate Your Pipeline Generated
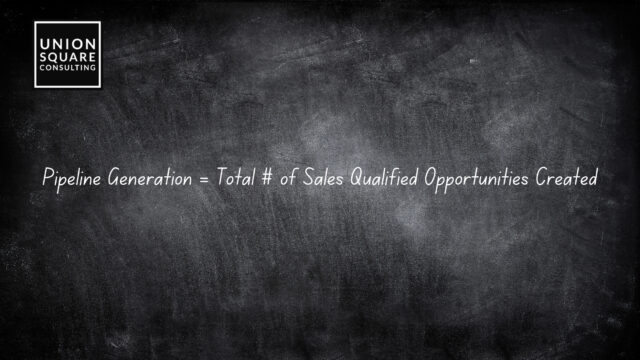
Pipeline Generation is simply the total number of SQOs, or Sales Qualified Opportunities, we have created in any given quarter. We use the number of created Opportunities, not closed Opportunities, because we want to see what is being generated each quarter.
While this is still a lagging indicator, it’s as close to the here and now as we can get.
One important thing to note, if our pipeline contains Opportunities that aren’t really qualified and shouldn’t be there, this calculation won’t provide much insight. We would see this reflected in our Close Rate, of course, but ultimately, without a well defined Sales Process and clear Entry Criteria for an Opportunity to enter our pipeline, this math is a somewhat futile exercise.
Step 3: Calculate Your Close Rate
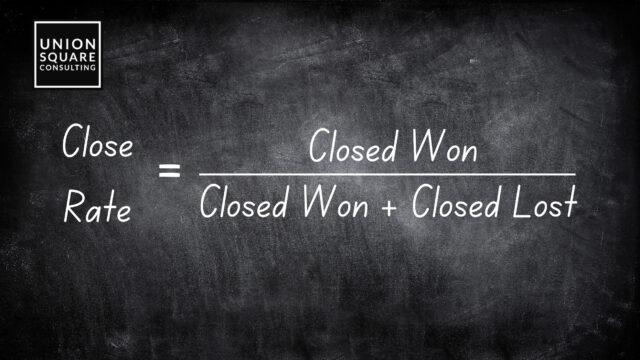
Close Rate is the total number of Opportunities Closed Won in last quarter divided by the total number of Opportunities Closed Won and Lost last quarter.
It’s important we don’t include Opportunities that are still open because it would give us an artificially low Close Rate. Eventually, all Opportunities will be won or lost. None remain open forever and we just want to estimate how many will be won.
We can then multiply that Close Rate by our Pipeline Generated to estimate the number of deals we expect to win at some point in time.
Step 4: Calculate Your Average Sales Price
To translate the number of deals we expect to win into the total sales we expect to close, in actual dollars, we need to know our Average Sales Price.
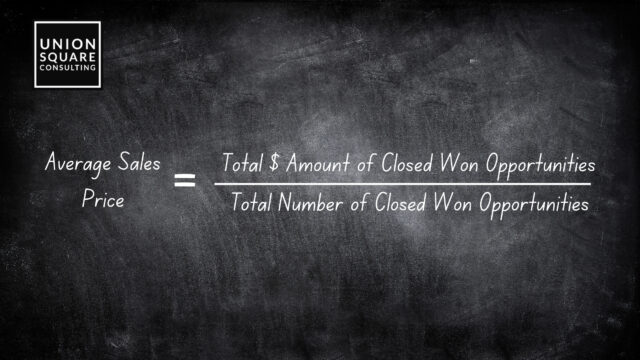
We calculate Average Sales Price by averaging the Amount of every Opportunity that was Closed Won last quarter. We do not calculate the average of Opportunities created, Closed Lost, or Open because we can’t trust how much someone says they might have bought when they didn’t actually sign a binding contract or haven’t done so yet.
One thing to note is that the definition of Amount can vary widely from one company to the next. Is it Monthly Recurring Revenue? Annual Recurring Revenue? Total Contract Value?
Ultimately it doesn’t matter so long as we are consistent. If we choose Monthly Recurring Revenue, or MRR, for example, the Pipeline Velocity we calculate will tell us how much MRR we are moving through the pipeline each quarter.
Step 5: Calculate Your Sales Cycle
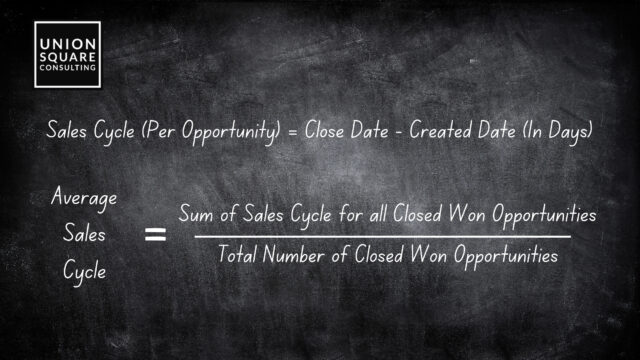
The last variable in our formula is our Sales Cycle and it’s there for one important reason. If our Sales Cycle gets longer, meaning it takes more time to close each Opportunity, we will close less deals this year than we would have otherwise.
To calculate Sales Cycle, we count the total number of days between the Created Date and Closed Date for each Opportunity that was Closed Won last quarter and then divide it by the total number of Opportunities Closed Won last quarter.
It’s important we only look at Closed Won Opportunities because Closed Lost Opportunities typically have much longer Sales Cycles and don’t really tell us anything about how long it takes to bring in revenue. It only tells us how long it takes to get a “no” from a prospect or to just give up and walk away.
Final Step: Compare Quarter Over Quarter
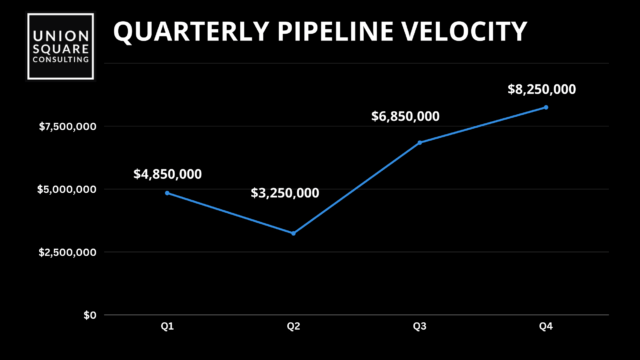
Congrats! We now have our Pipeline Velocity calculated!
Unfortunately, it doesn’t tell us much on it’s own though. What we really want to do is to compare our numbers quarter over quarter to see if our Revenue Engine is moving pipeline through our funnel faster or slower than we did last quarter.
This translates into a story that is much easier for our busy leaders and Revenue Team to understand than throwing four different metrics at them.
For example, we might say:
“We increased our Pipeline Velocity this quarter by X percent! This means that our team is moving more revenue through the funnel and we can expect to close more business each quarter if we keep it up!
This happened because we generated more pipeline and improved our Close Rate. Unfortunately, we didn’t increase our Average Sales Price and our Sales Cycle got a little longer, which hurt our Pipeline Velocity, but overall we improved and we can work on that this quarter!”
Extra Credit: Go a Layer or Two Deeper
For extra credit we can go deeper and run the same calculation for different:
- Pipeline Sources/Channels
- Outbound vs. Inbound
- Low Intent vs. High Intent Inbound
- Different Marketing Channels, Partners, etc.
- Pipelines
- New Business vs. Expansion
- Definitions of Average Sales Price
- Recurring vs. One-Time Revenue
- Products
- Geographies
- Etc.
Where we want to dig deeper depends on what our Revenue team is trying to accomplish and what variables we think may have the biggest impact on our overall sales number.
The Devil is always in the details. Good luck!
When you’re ready, here’s how we can help:
Get a Free 1:1 Revenue Efficiency Workshop
Get one of our Senior Revenue Strategists to yourself for 1 hour and leave with a plan to increase the money-making power of your go-to-market operations.
Hire Us!
Bring us on as your Strategic RevOps Team and realize the growth potential of your revenue engine. There are 3 ways to work with us.
Get more tips like these, sent right to your inbox.
Subscribe for fresh, relevant revenue growth tips delivered every week.